Beginner's Guide
A Beginner's Guide to Data Analysis in Tomat: Connecting Data and Exploring Insights
When it comes to data integration and analysis, Tomat stands out as a user-friendly platform that simplifies the process of data analysis and exploration. In this blog article, we will walk you through the initial steps of connecting your data and exploring valuable insights using Tomat. Let's get started!
Tomat Interface
In our Catalog, you can store files that you work with. Remember that Tomat is a desktop app, which means no data will leave your computer and appear somewhere in the cloud. We prioritize security the most. If you do not have a data warehouse, our Catalog will serve as your database.
In Flows, you can modify your data by merging data, adding new columns, and building dashboards.
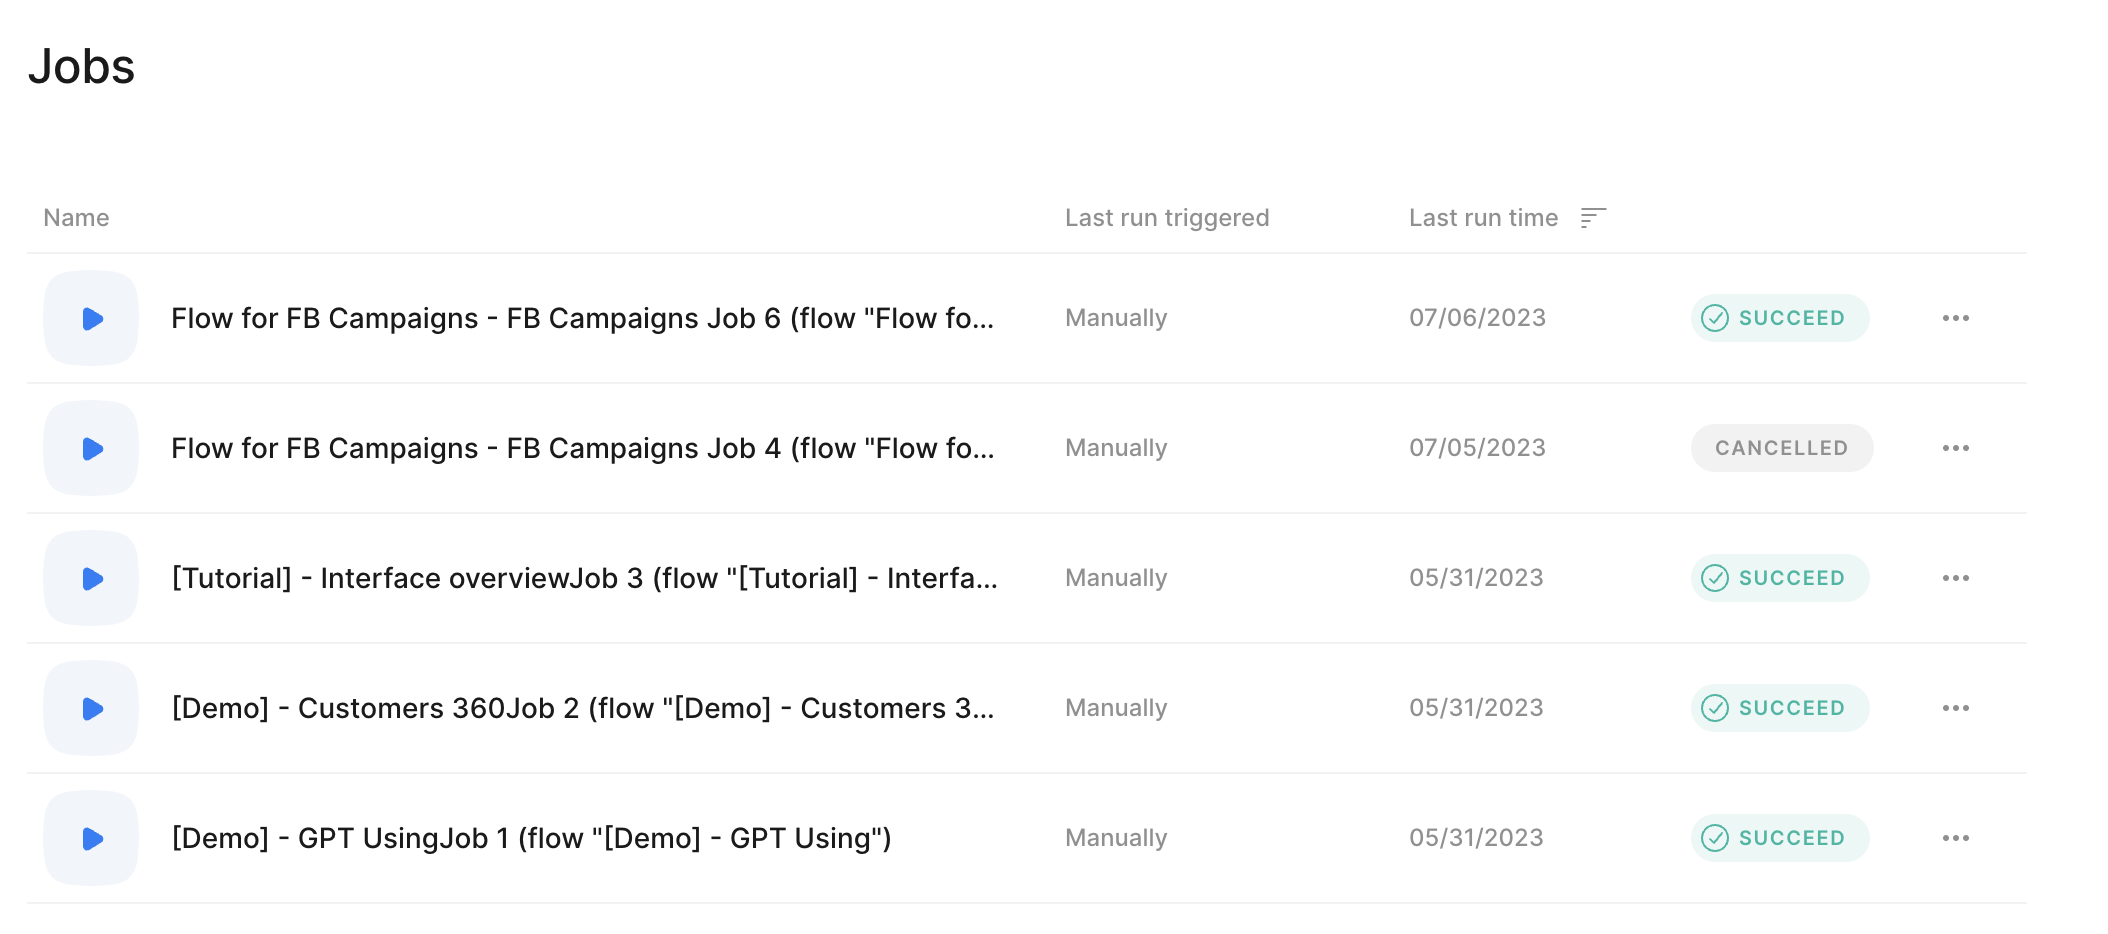
Jobs are the list of your completed data analytics tasks. It's like a folder with final reports.
Use Connectors to connect to your datawarehouse and pull data directly from there.
Connect Data
Upon landing on the Tomat home page, the first step is to connect your data. Tomat offers two options for data connection: local CSV or Excel files and cloud database integration. If your data is stored locally, simply choose the local file upload option and select the desired CSV file. Alternatively, if your data resides in a cloud database, Tomat allows you to connect directly to it.
Upon proceeding, you'll be directed to the exploration page. Here, Tomat provides a comprehensive set of tools to validate and control data quality, as well as examine value distributions for each column. By leveraging the exploration bar, you can gain quick insights into your data.
For instance, let's say you want to filter out only active advertising campaigns. Tomat allows you to effortlessly apply this filter and analyze the results.

If your analysis concludes at this stage, you have the option to download the newly refined dataset directly to your computer.
However, if you wish to further analyze or transform the data, simply click on "Add to Flow" to seamlessly continue your data preparation work.

Analyze data in Tomat
Now we are ready to start our data analysis project in Tomat!
Once you have launched a data flow with your dataset, you will find a preview of it at the bottom of the screen. This allows you to have control over the data you'll be working with.
On the right side of the screen, you'll notice a range of auto-cleanup suggestions. These suggestions can help streamline your dataset by removing empty rows or formatting text case, among other options. You have the flexibility to apply these suggestions or ignore them, depending on your specific needs and data requirements.
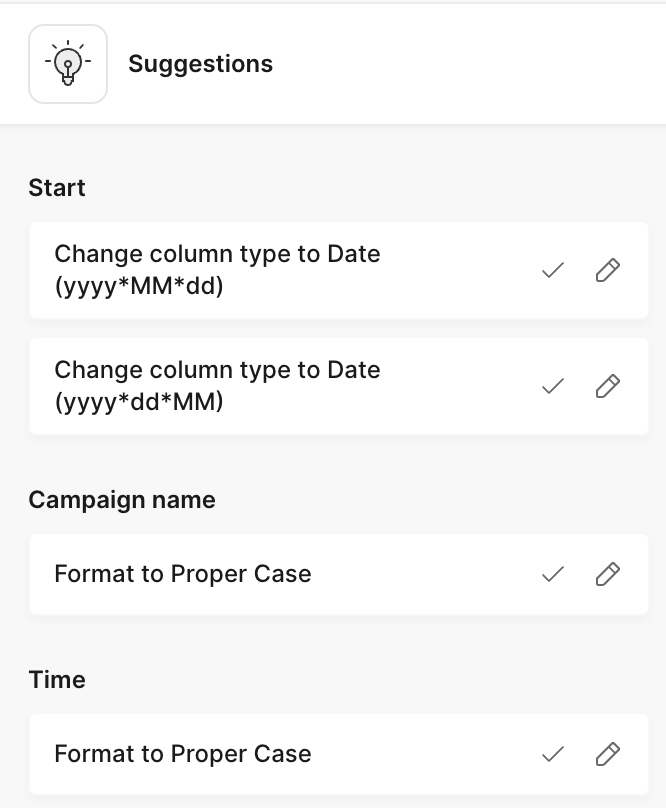
Also, on the right sidebar, you will perform all your data transformations.
At the top menu of the Tomat interface, you'll come across a range of operators referred to as Nodes. These Nodes serve as the building blocks for manipulating your data. They are similar in concept to what you might encounter when working with spreadsheets or SQL. These powerful operators enable you to carry out a wide array of data transformations and analysis tasks.

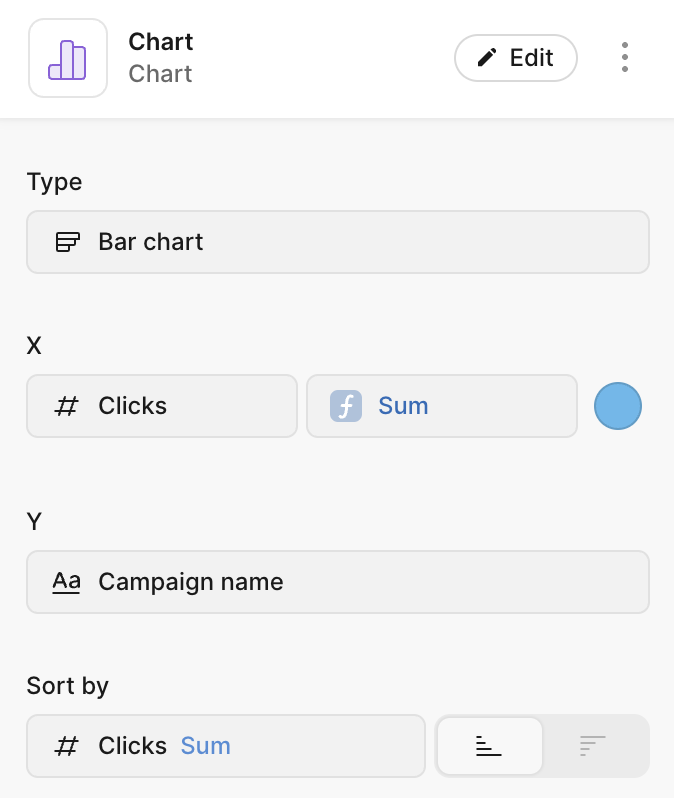
As an example, let’s start with creating a visual dashboard out of our dataset. To begin chart creation in Tomat, select the Chart node and specify the axes that will represent your data. This intuitive process allows you to choose the most relevant variables to visualize. Upon completion, Tomat generates a dashboard displaying the chart based on your specifications.
Enhance Analysis with Custom Metric
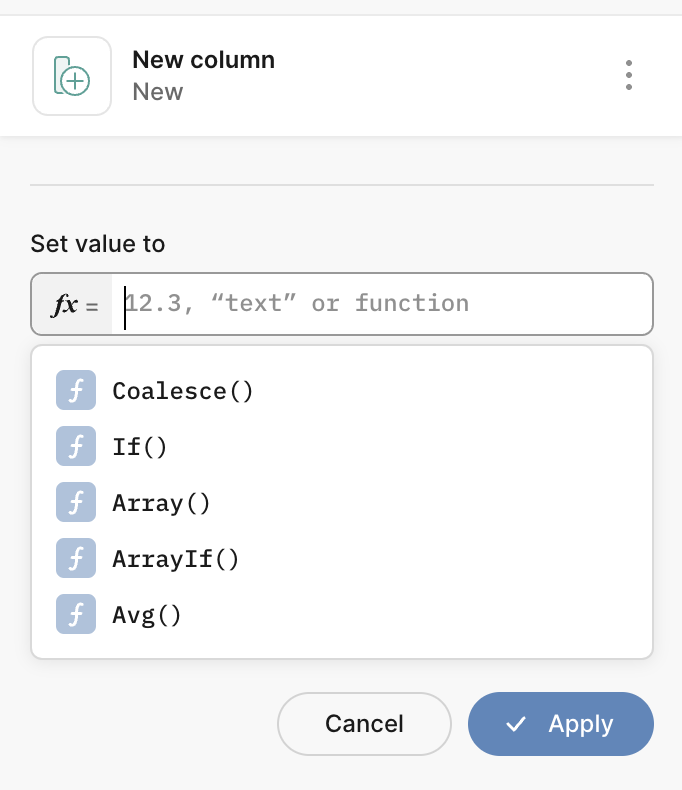
Tomat offers the flexibility to enhance your analysis by incorporating custom metrics. Let's take a step back in our analysis and introduce a new custom metric to our filtered table. By adding a new column, we can perform calculations that provide deeper insights into our data.
To begin, click on the "New Colum” node on the Tomat menu. This action will prompt the appearance of the right sidebar, where you can define the formula or expression for the custom metric. Tomat offers a wide array of expressions that can be utilized to calculate the desired custom metric.
Download Your Results
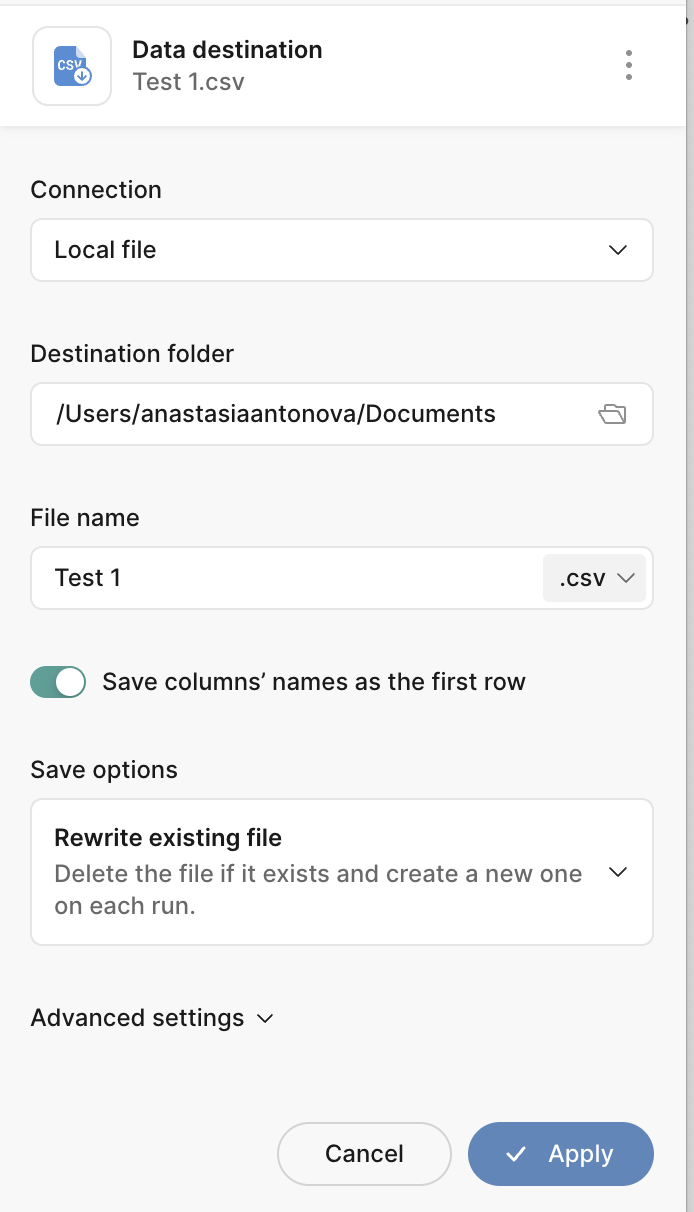
To finalize the data manipulations, you can easily export your results by clicking on the “Output” node. From there, you have the option to select a destination folder on your computer or directly push the table to a cloud data warehouse. To apply all the transformations created, simply click on the "Run" button located at the top of the screen.
Once the transformations are applied, the results can be found in the Jobs section. There, users will discover two insightful charts along with the transformed table, providing a comprehensive and visually appealing overview of the data analysis.
Tomat's user-friendly interface and powerful capabilities make it an invaluable tool for any data analyst or researcher. Experience the power of Tomat today and unlock a wealth of knowledge hidden within your data.
Last updated